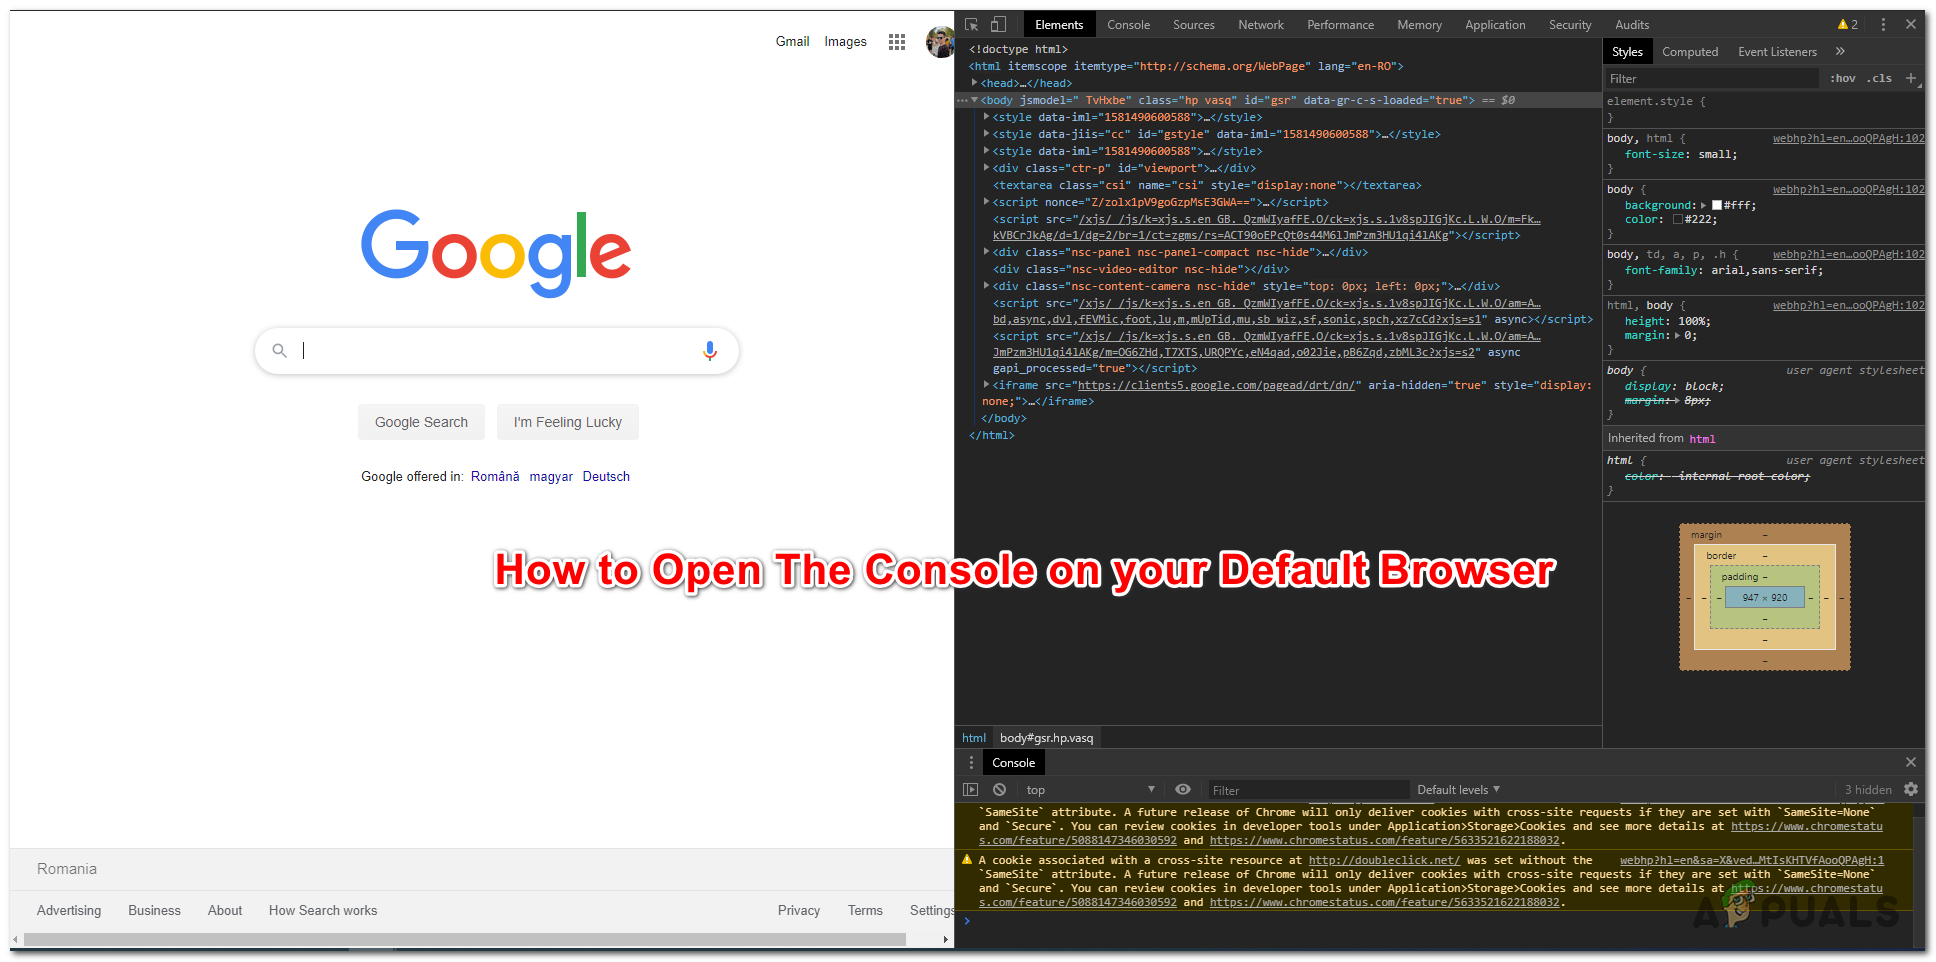
Since there are only four different browsers with over 5% market share (Chrome, Safari, Edge, and Firefox), we will show you multiple ways of opening the console on each of them. But keep in mind that with each browser, the elements & errors are generally colour-coded and labelled differently.
How to Open the Console on Google Chrome
On Chrome, there are actually three different ways that will allow you to open the built-in console. Regardless of the Chrome build that you’re using, you can use one of these shortcuts to open and close the built-in console:
F12Ctrl + Shift + J (Cmd + Option + J on Mac)
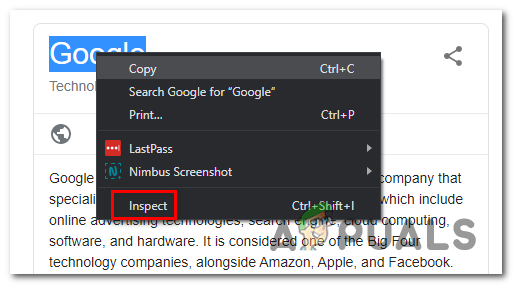
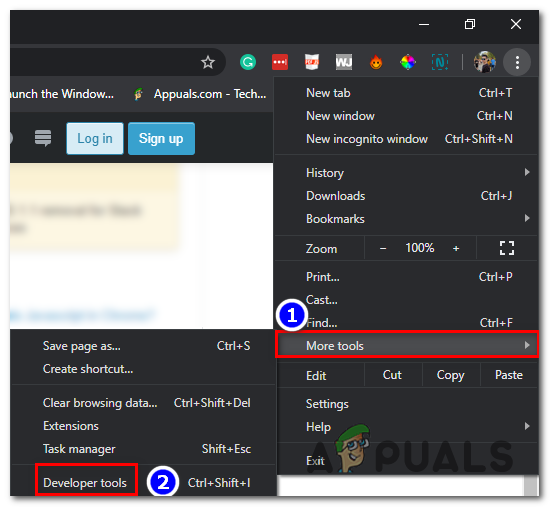
Keep in mind that the same shortcuts can also be used to hide the console. By default, the console of Google Chrome takes exactly half of the screen, but you can adjust the ratio easily via the slider on the middle and the browser will remember the modification the next time you open the console. If you want to focus on a specific element, you can simply highlight it with your mouse and then right-click on it > Inspect. This will open up the Elements tab and Styles tab of the console, allowing you to focus on the element at hand. However, you can also access the console via the GUI menu of Google Chrome. To do this, simply click on the action button in the top-right corner and go to More Tools > Developer Tools. If you’re looking to work as efficiently as possible, here’s a list of Chrome Console shortcuts that you can use.
How to Open the Console on Google Microsoft Edge
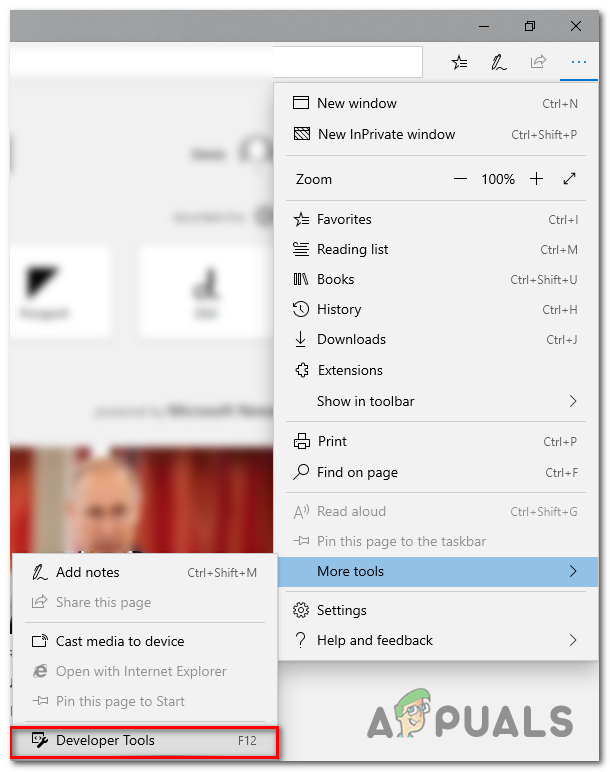
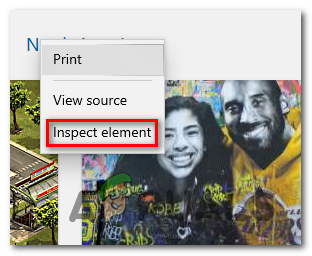
Like every other browser, Microsoft Edge also has a Console tool meant for developers doing interactive debugging or ad hoc testing. This tool logs information associated with the webpage that’s being visited. You’ll find information related to Javascript, network requests and security errors. The easy way of opening the Console Tool on Microsoft Edge is by using the predefined shortcut (F12 Key). But you can also do it via the GUI menu by clicking on the action button (top-left corner) > More tools > Developer Tools. And similar to the functionality on the other browsers, Microsoft Edge also allows you to inspect specific elements using the built-in console. To do this, simply select and right-click on an element and choose Inspect Element. Here’s a list with some useful shortcuts that you can use inside the built-in console of Microsoft Edge:
How to Open the Console on Mozilla Firefox
The built-in console on Mozilla Firefox works a little differently than the other equivalents that we’ve analyzed so far. What I mean by this is that it will automatically open in a standalone window, rather than splitting your browser screen in half. This allows for a more productive approach for people with second screens but might get in the way of users that need to work with one small screen. (If you’re in this scenario, you can use Alt + Tab shortcut to cycle back and forth between Firefox and the associated Browser Console. To open up the build-in browser console on Mozilla Firefox, you have three options:
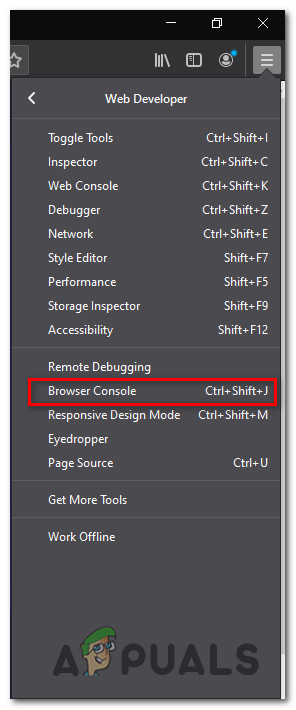
You can either use the universal shortcut – Ctrl + Shift + J (or Cmd + Shift + J on a Mac)You can open it from the action menu – By clicking on the action menu > Web Developer > Browser Console.
Or you can force the Browser Console to open directly by launching Firefox from the command line and passing the ‘-jsconsole’ argument:/Applications/FirefoxAurora.app/Contents/MacOS/firefox-bin -jsconsole
Note: Firefox also includes a Web console, which is very similar to the Browser console but it’s applied on a single content tab rather than on the whole browser.
How to Open the Console on Google Safari
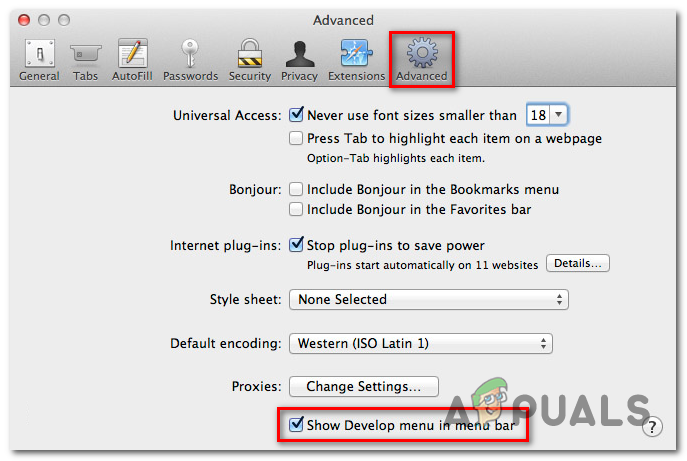
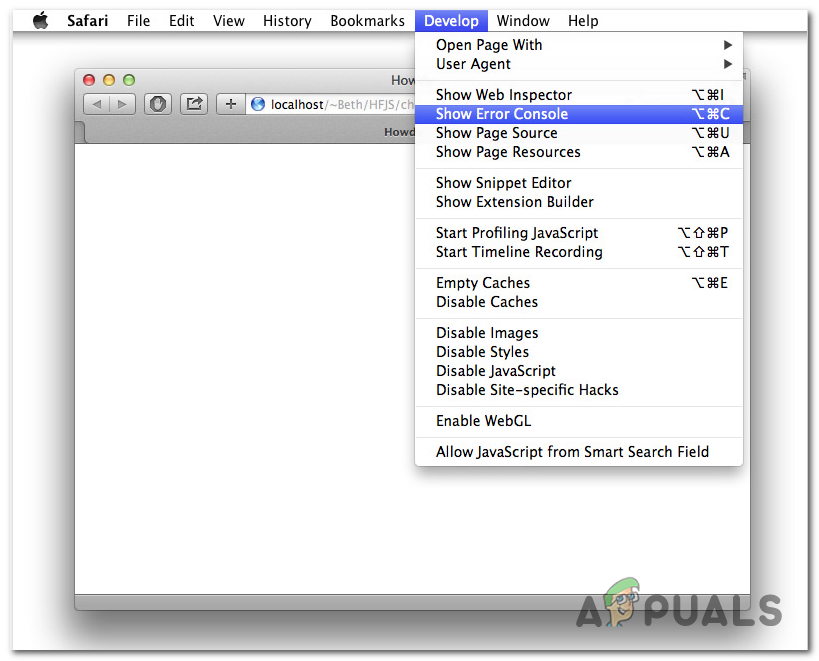
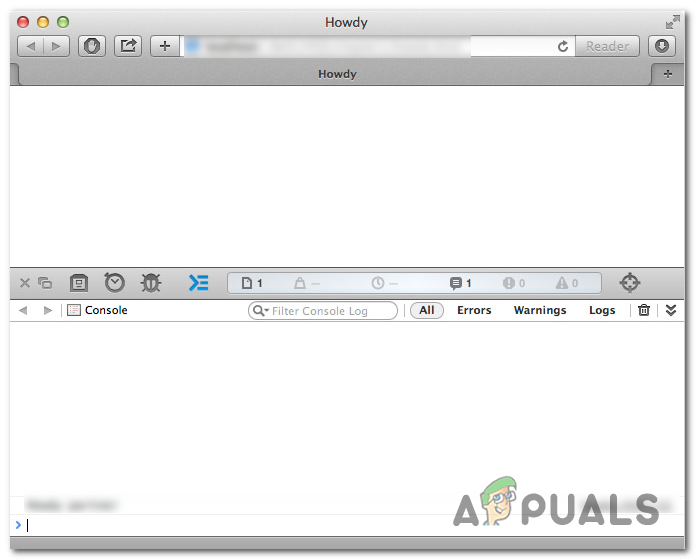
Unlike every other browser that we’ve looked at so far, the Error Console on Safari is disabled by default. Because of this, you’ll need to do an extra step in order to enable it on your browser. To do this, open Safari and click on the Preferences tab. Once you’re inside the Preferences tab, click on the Advanced tab and check the box associated with Show Develop menu in the menu bar. Now that you’ve made the Console visible, you can open it by accessing the Develop tab at the top and clicking on Show Error Console. Keep in mind that Safari has a dynamic way of displaying the error console. If the window is small when you open the console, you will see it in a completely different window. In case you want to open the console in the same window as your page, you will need to ensure that the browser window is of full size before opening the Error console.
How to Disable Video/Audio Autoplay in Chrome, Firefox, and Microsoft Edge?How Share Passwords Between Google Chrome, Microsoft Edge and FirefoxDisable or Enable Hardware Acceleration in Web Browers (Edge, Chrome and…How to Export Bookmarks on Chrome, Firefox and Edge