Creating a scatter chart on Excel is pretty straightforward – all you need to do is create a column with the coordinates for the graph’s X-axis and a column with the coordinates for the graph’s Y-axis, feed the raw data to the Excel and the absolute wizard that the application is, it will process the data, create a scatter chart and plot the coordinates you fed it onto the scatter chart. Like all graphs, a scatter chart has an X-axis and a Y-axis. Sometimes, Excel users, for various different reasons, need to switch a scatter chart’s axes with one another – meaning they want to change the X-axis values in order for them to be plotted on the Y-axis and the values currently on the Y-axis to be plotted on the X-axis. While it might sound confusing and a bit complicated, it is not – switching the X-axis of a scatter chart with its Y-axis and vice versa on an Excel spreadsheet is quite easy. The following are the two different methods you can use to switch the axes of a scatter chart in Excel:
Method 1: Use the Switch Row/Column option
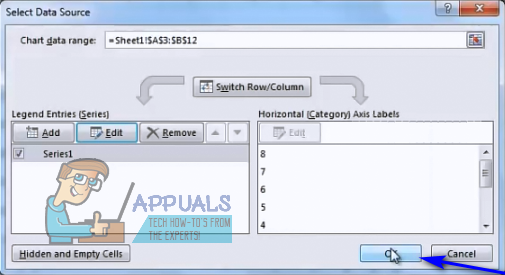
Microsoft Excel has a Switch Row/Column that has a few different uses, one of them being switching the axes or charts and graphs such as the average scatter chart. Even though this method’s success rate with scatter charts isn’t all that high, it is still a method worth trying. To try and switch the axes of a scatter chart using this method, you need to:
Method 2: Swap the values for each axis with one another
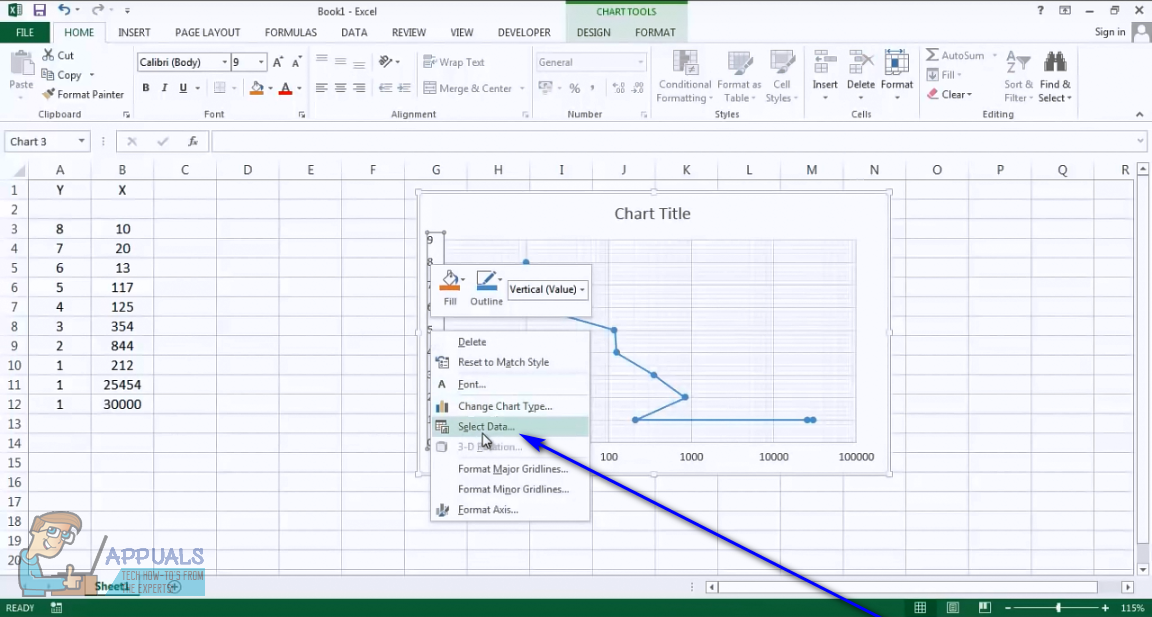
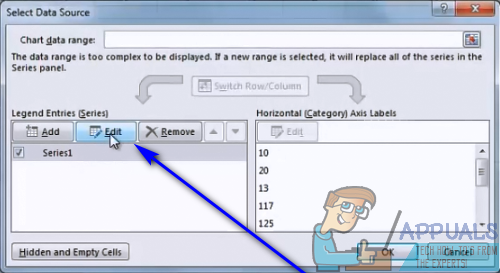
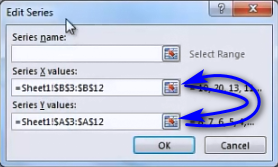
If Excel’s Switch Row/Column option doesn’t work for you, fear not – it isn’t the end of the world (at least not yet). You can still switch the axes of the target scatter chart by manually swapping the coordinates of the graph’s X-axis for the coordinates of the graph’s Y-axis and swapping the coordinates of the graph’s Y-axis for the coordinates of the graph’s X-axis. Manually swapping the coordinates for each of the chart’s axes with each other is bound to get Excel to switch the axes of the scatter chart. If you would like to switch the axes of a scatter chart in Excel using this method, simply: As soon as you click on OK, the axes of the selected scatter chart will be reversed and Excel will re-plot the scatter chart to reflect the change.
Overwatch update replaces Hanzo’s Scatter Arrow and adds a new mapHow to Make an Hierarchical Chart on Microsoft PowerPointBack 4 Blood and The Ascent Lead the Steam Top Sellers ChartIntel Arc A-Series GPUs Might Not be as Fast as Early Reports Suggested…